Diagnose first. Then build.
Three businesses, three different leaking stages. Every number here is verified, documented, and belongs to exactly one client. No composites.
A website rebuilt around the buyers it was missing
Strong services, invisible online. New architecture, sharper messaging, and SEO put the firm in front of the right people, and LinkedIn amplified it.
A quoting funnel that stopped losing interested customers
Every quote used to require an in-person visit. Connecting the website, quote software, and phone system turned interest into booked work.
From one-off visits to memberships and recurring revenue
Customers saw a transactional offer, so they bought once and drifted. A restructured membership ecosystem changed what they bought and how often they came back.
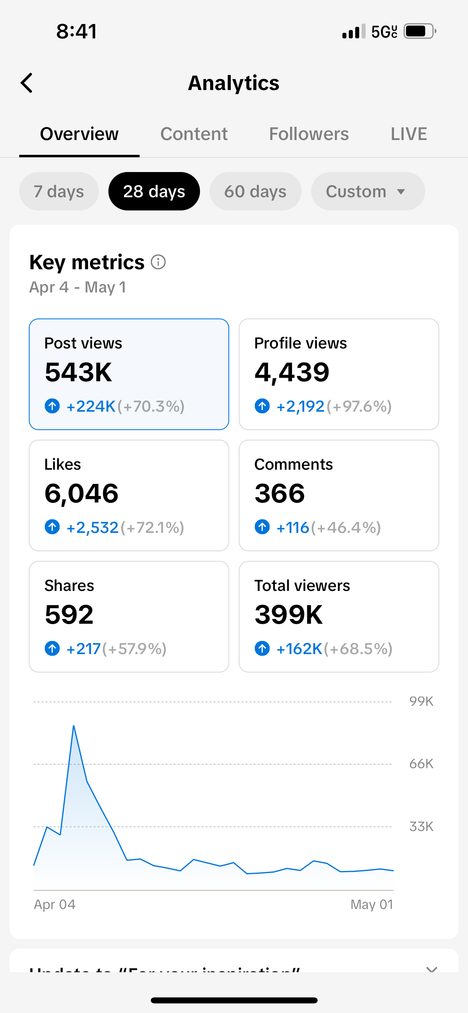
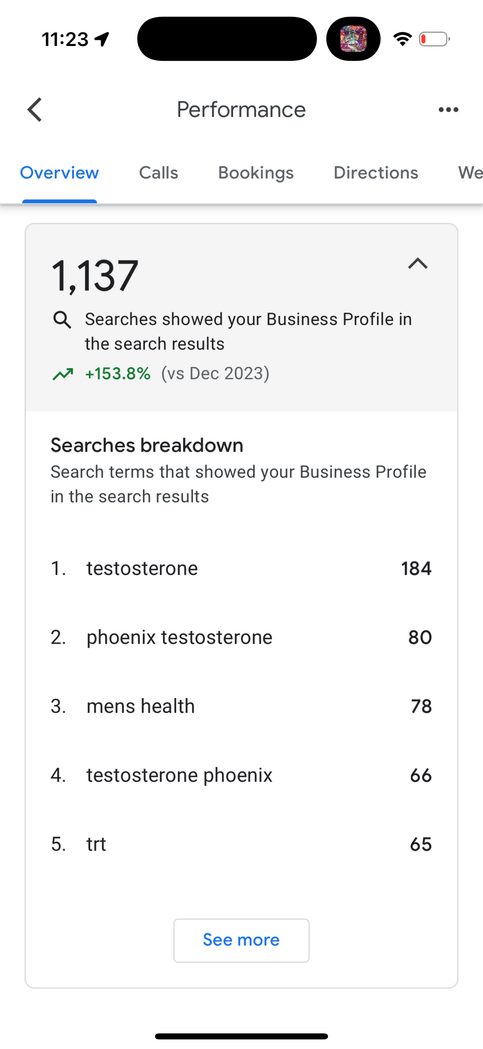
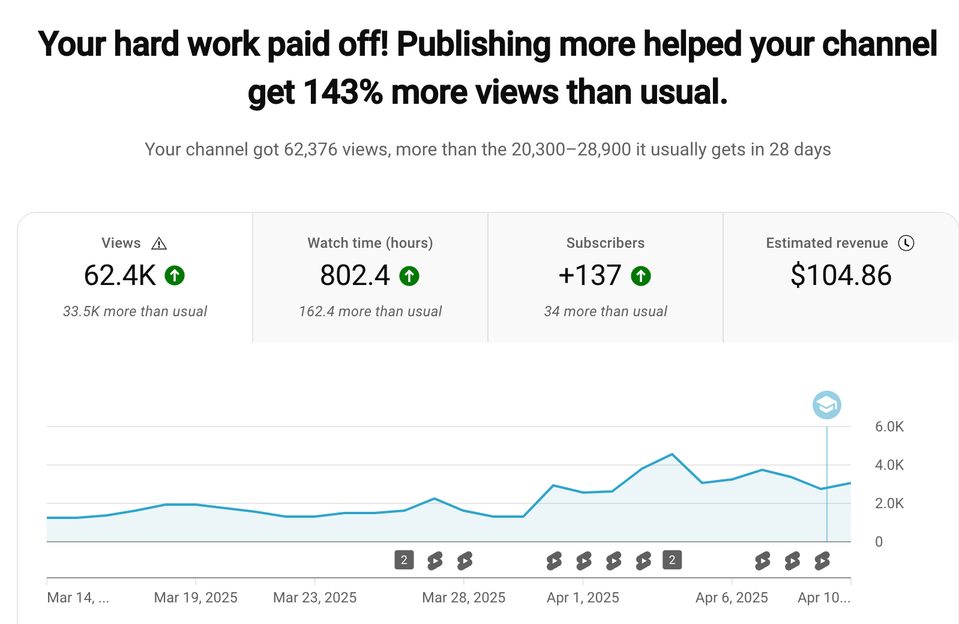
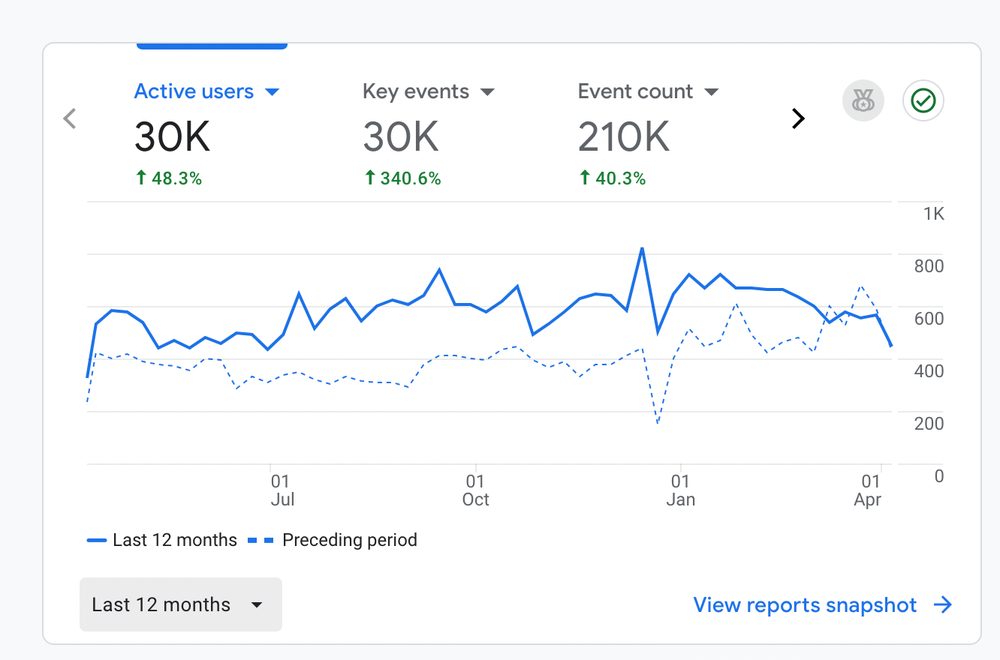
Numbers from other engagements.
Smaller projects and single-channel wins, each labeled with the engagement it came from.
Looking for the work itself?
The websites, brands, campaigns, and print pieces behind these numbers now live on their own page.
Browse the portfolioWondering what your version of these numbers looks like?
Start by finding your leaking stage. The quiz takes under three minutes.